Google Analytics 4 provides valuable insights into the performance of your company’s website, which can help you make data-driven decisions to optimize user engagement and achieve your goals and objectives. But, do you know which reports are the most useful in GA4? If not, here’s a quick guide with the 7 reports and metrics every business owner and marketing manager should track on a regular basis.
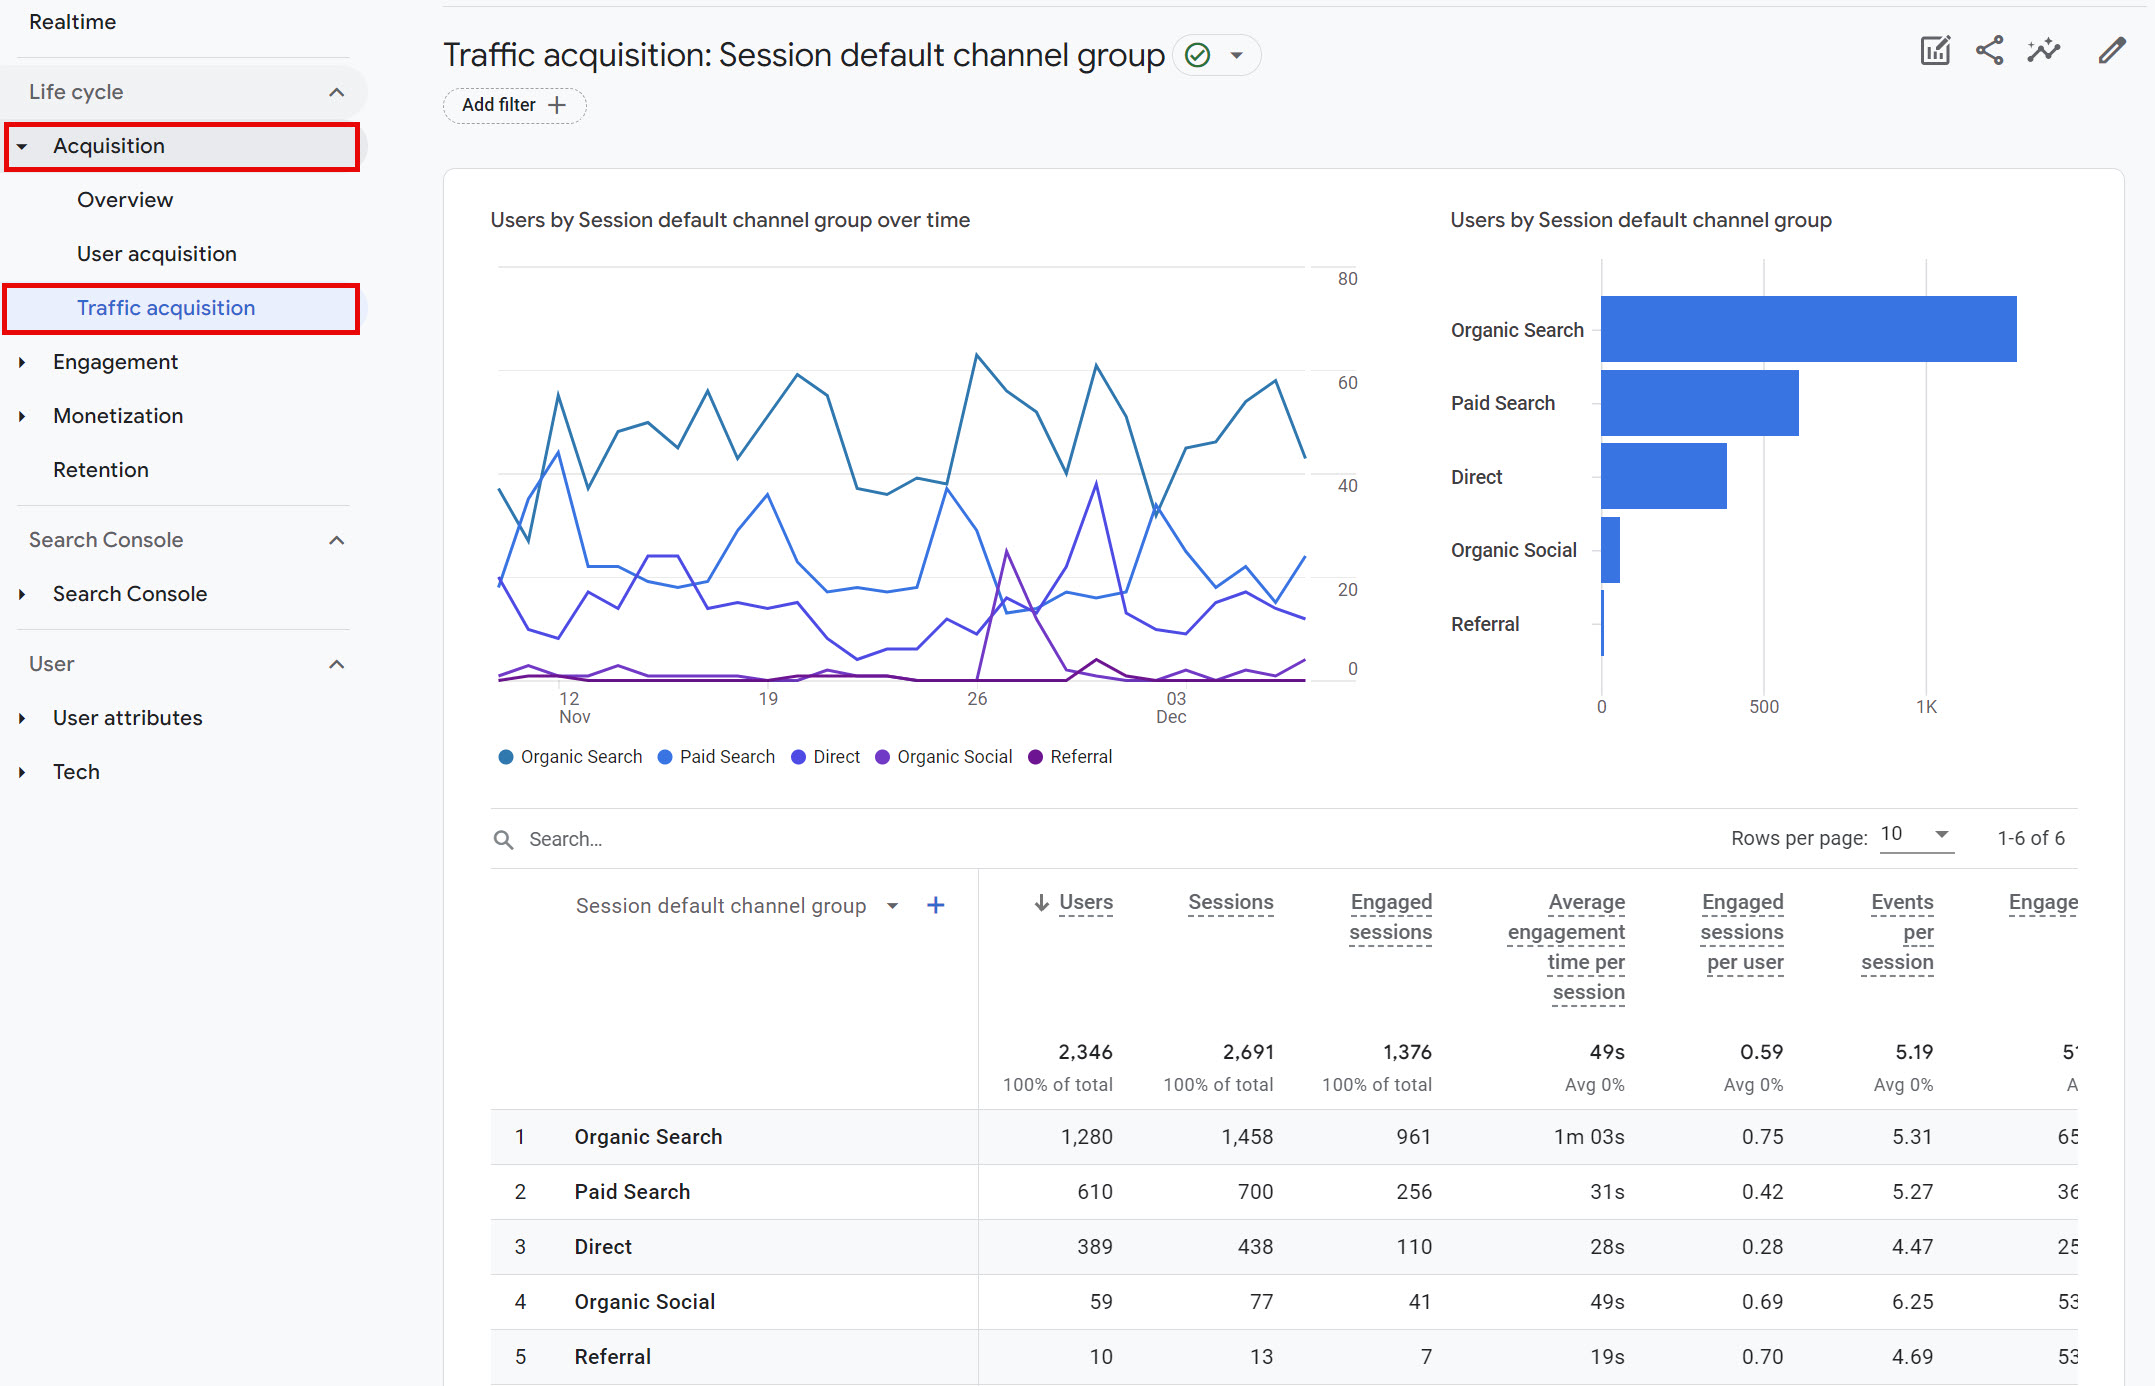
1. Overall Traffic
This metric measures the total number of sessions on your website. Tracking this metric can help you understand how many users are visiting your website over time and pinpoint which marketing channels generate the most high quality traffic, such as organic, paid search, social media, or referral traffic.
How to Access This Report:
- In GA4, click on “Reports” > “Acquisition” > ‘Traffic acquisition’.
2.Traffic Sources
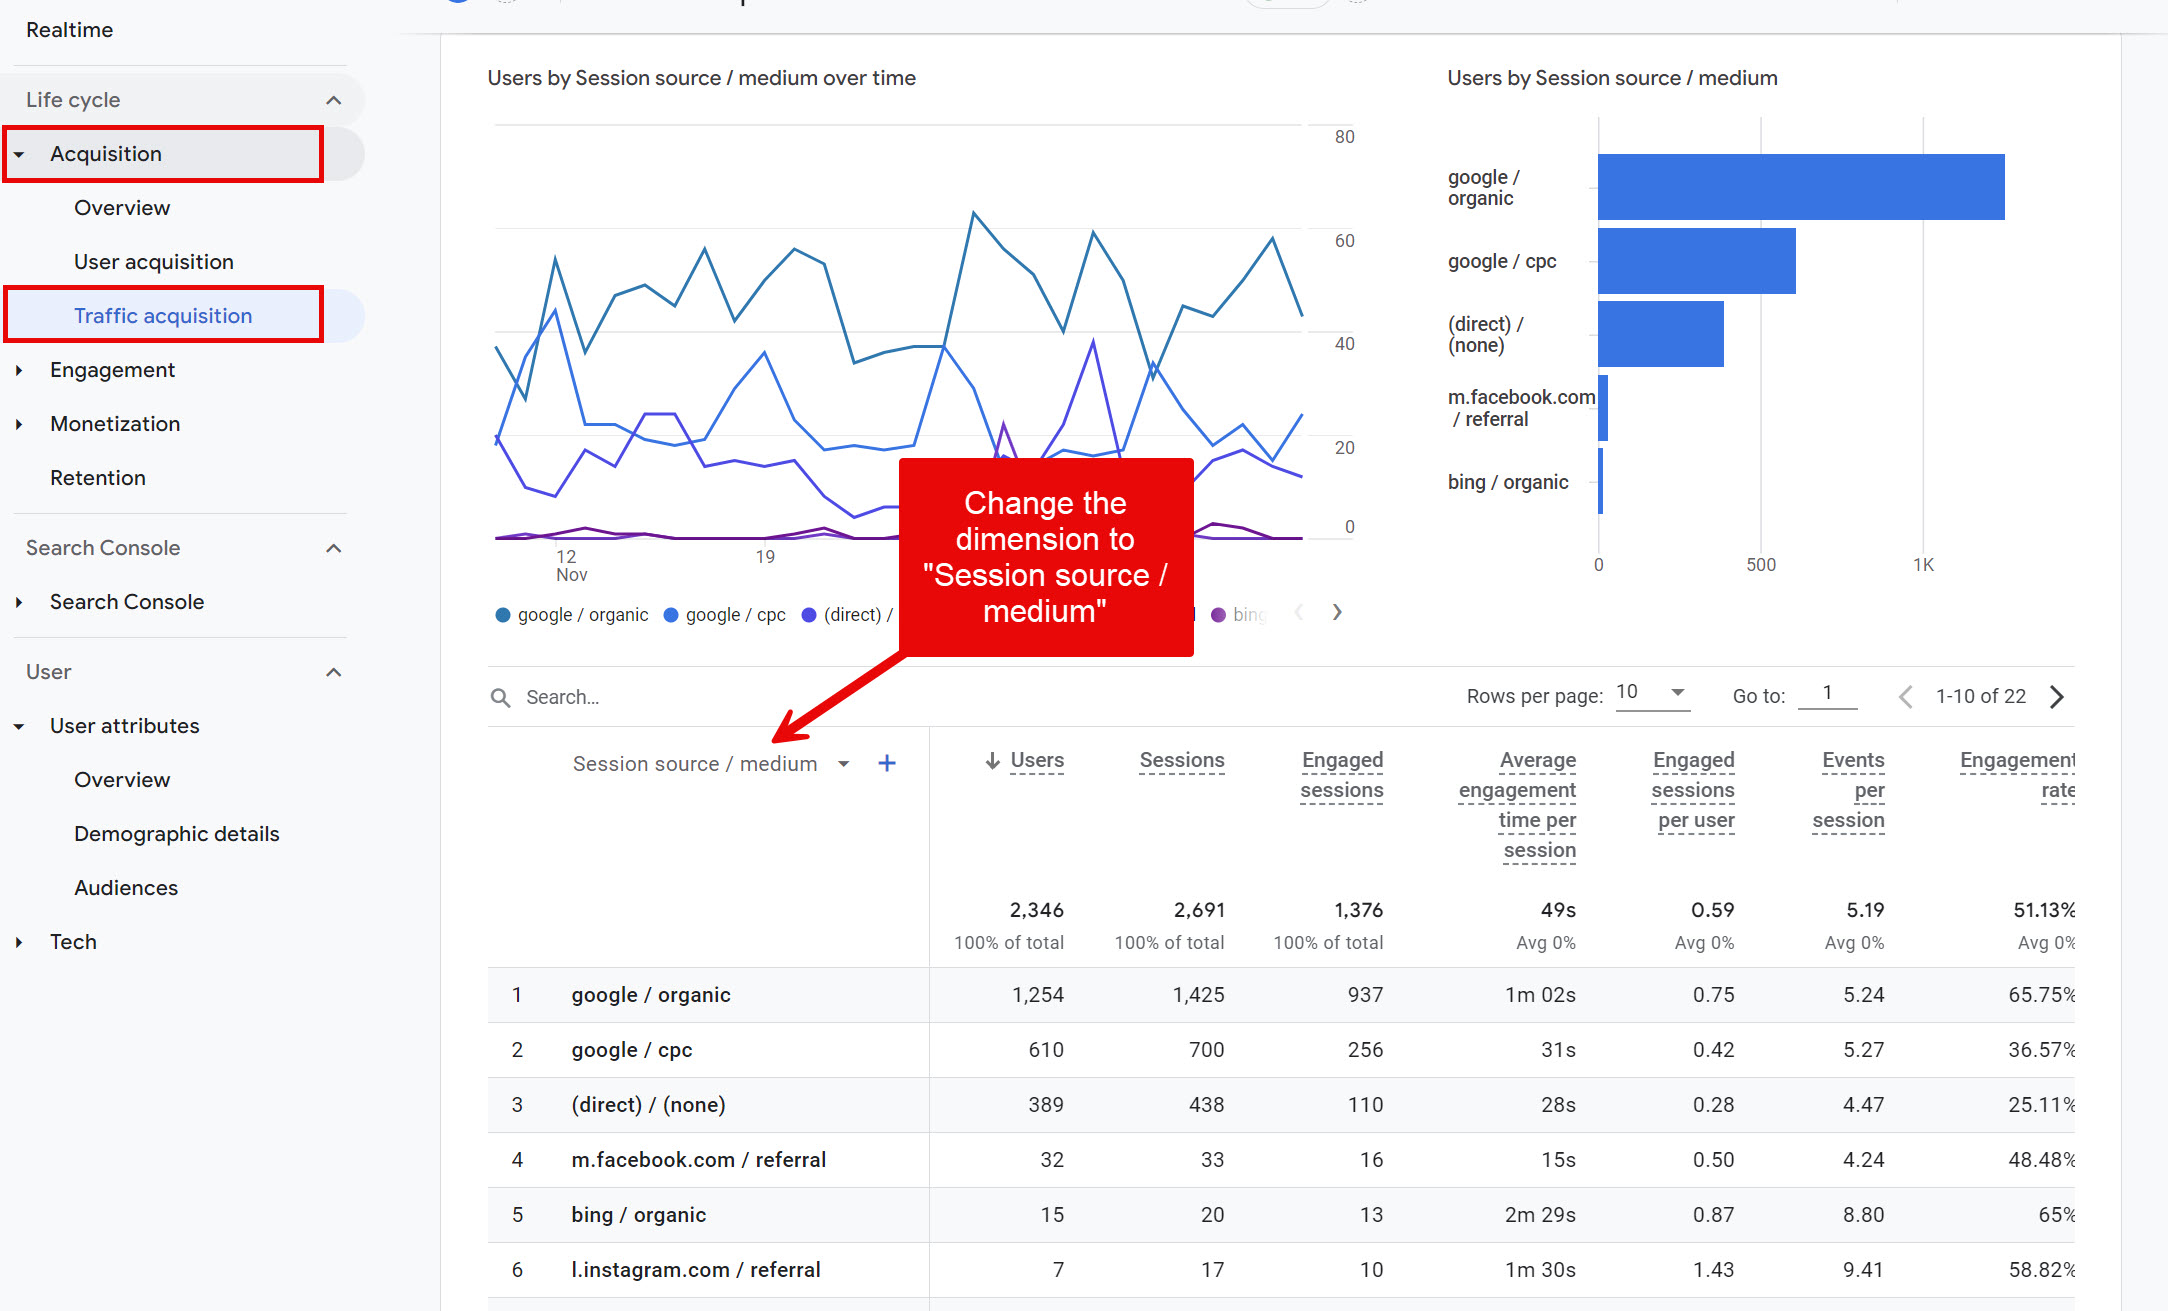
The Traffic Sources metric provides more detailed information about each traffic source. Tracking this metric can help you understand which source is driving traffic to your website.
How to Access This Report:
- In GA4, click on “Reports” > “Acquisition” > “Traffic acquisition”.
- Change the dimension to “Session source / medium”
3. Audience Location
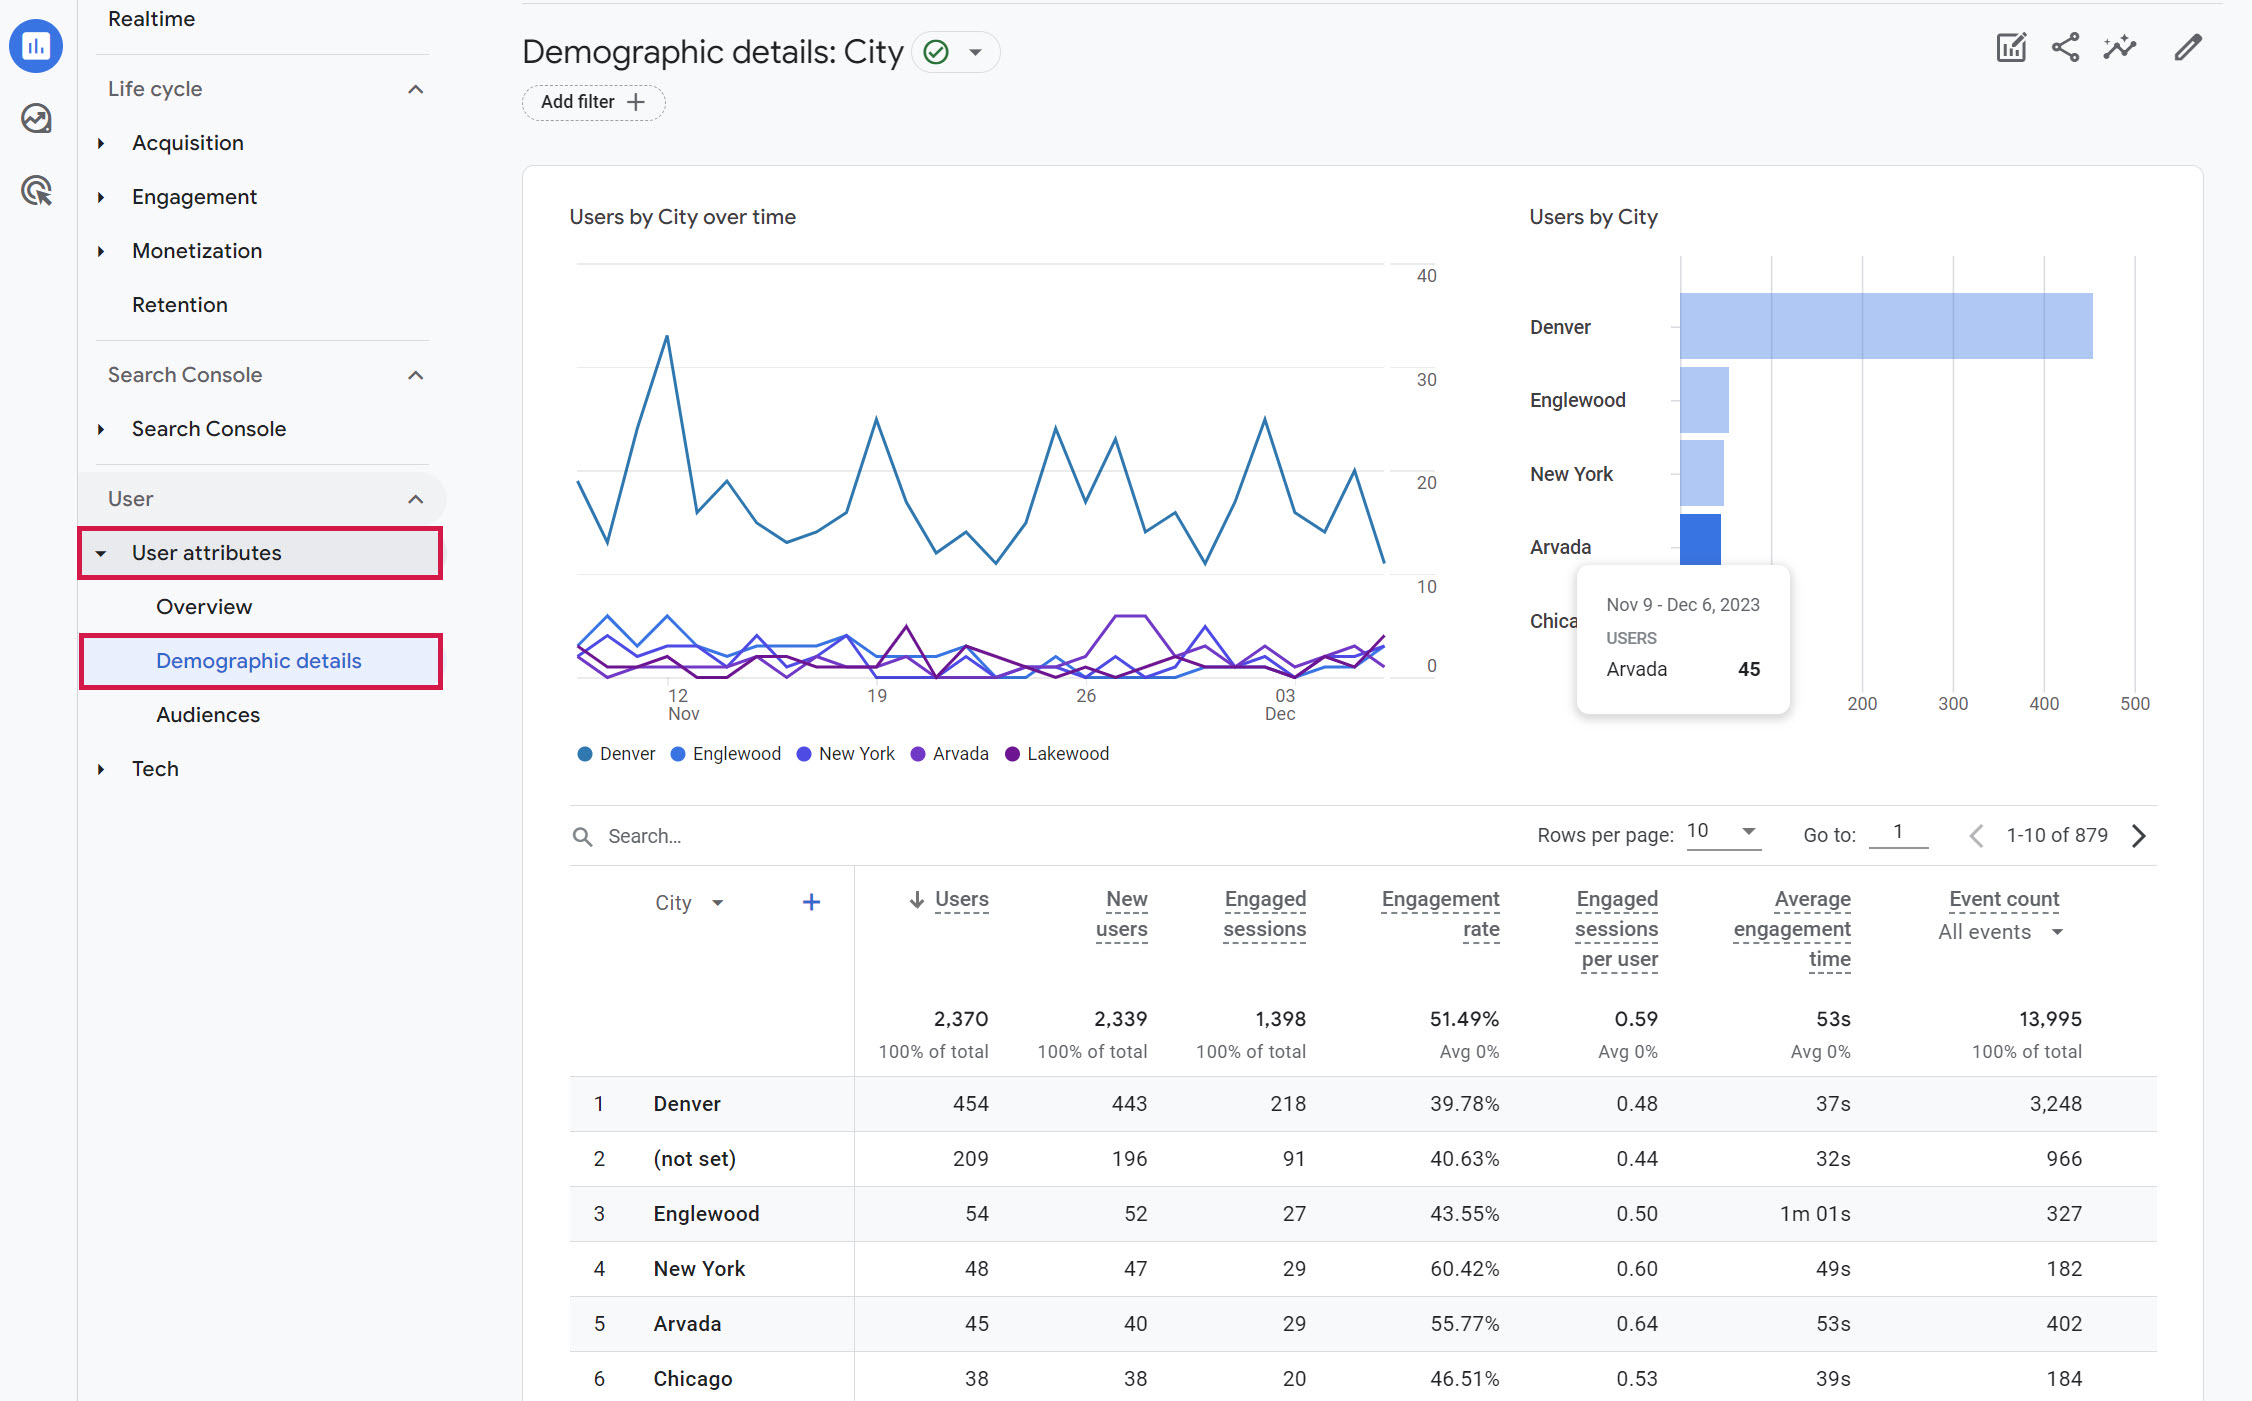
The Audience Location metric provides information about the geographic location of your website visitors. Tracking this metric can help you identify your most engaged and profitable audiences. It includes any audience with at least one user in the specified time period.
How to Access This Report:
- In GA4, click on “Reports” > “User Attributes” > “Demographic details”.
- Select the “Country” or “City” dimensions to see metrics by country or city.
4. Landing Pages & Top Content
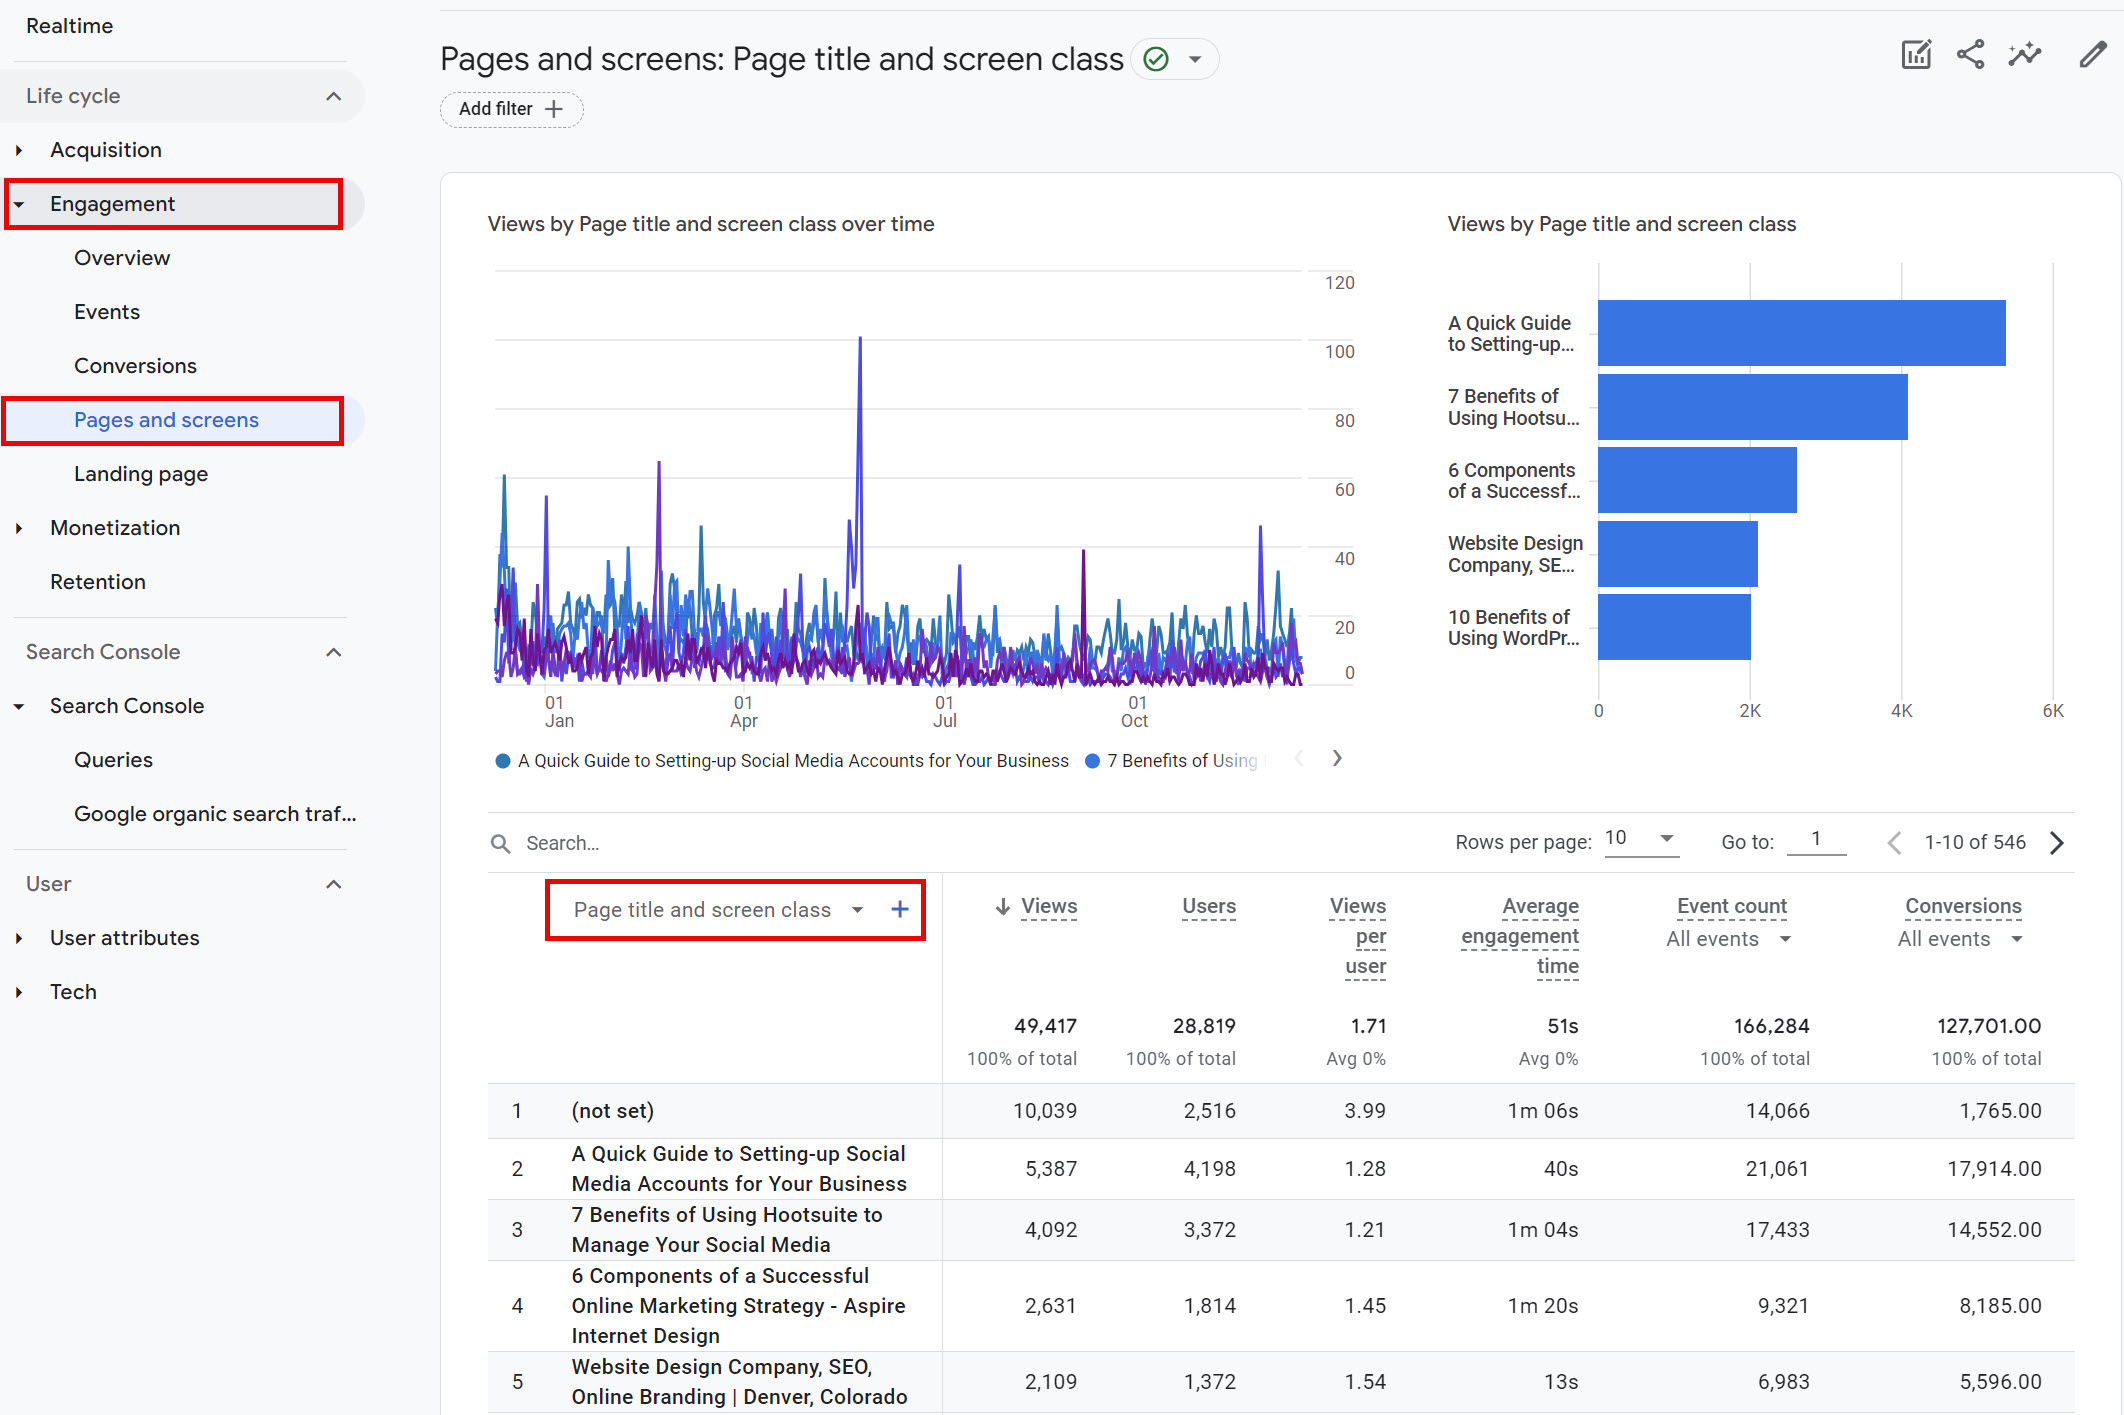
The Landing Pages and Top Content metric measures the number of times each page on your website or app was the first page viewed by a user during a session. Tracking this metric can help you understand which pages are attracting the most traffic and will enable you to optimize them for better user engagement.
How to Access This Report:
- In GA4, click on “Reports” > “Engagement”‘ > “Pages and screens” (This shows your highest-performing landing pages.)
- Select the “Page title and screen class” dimension to get more detailed metrics for each landing page.
5. Search Console Data
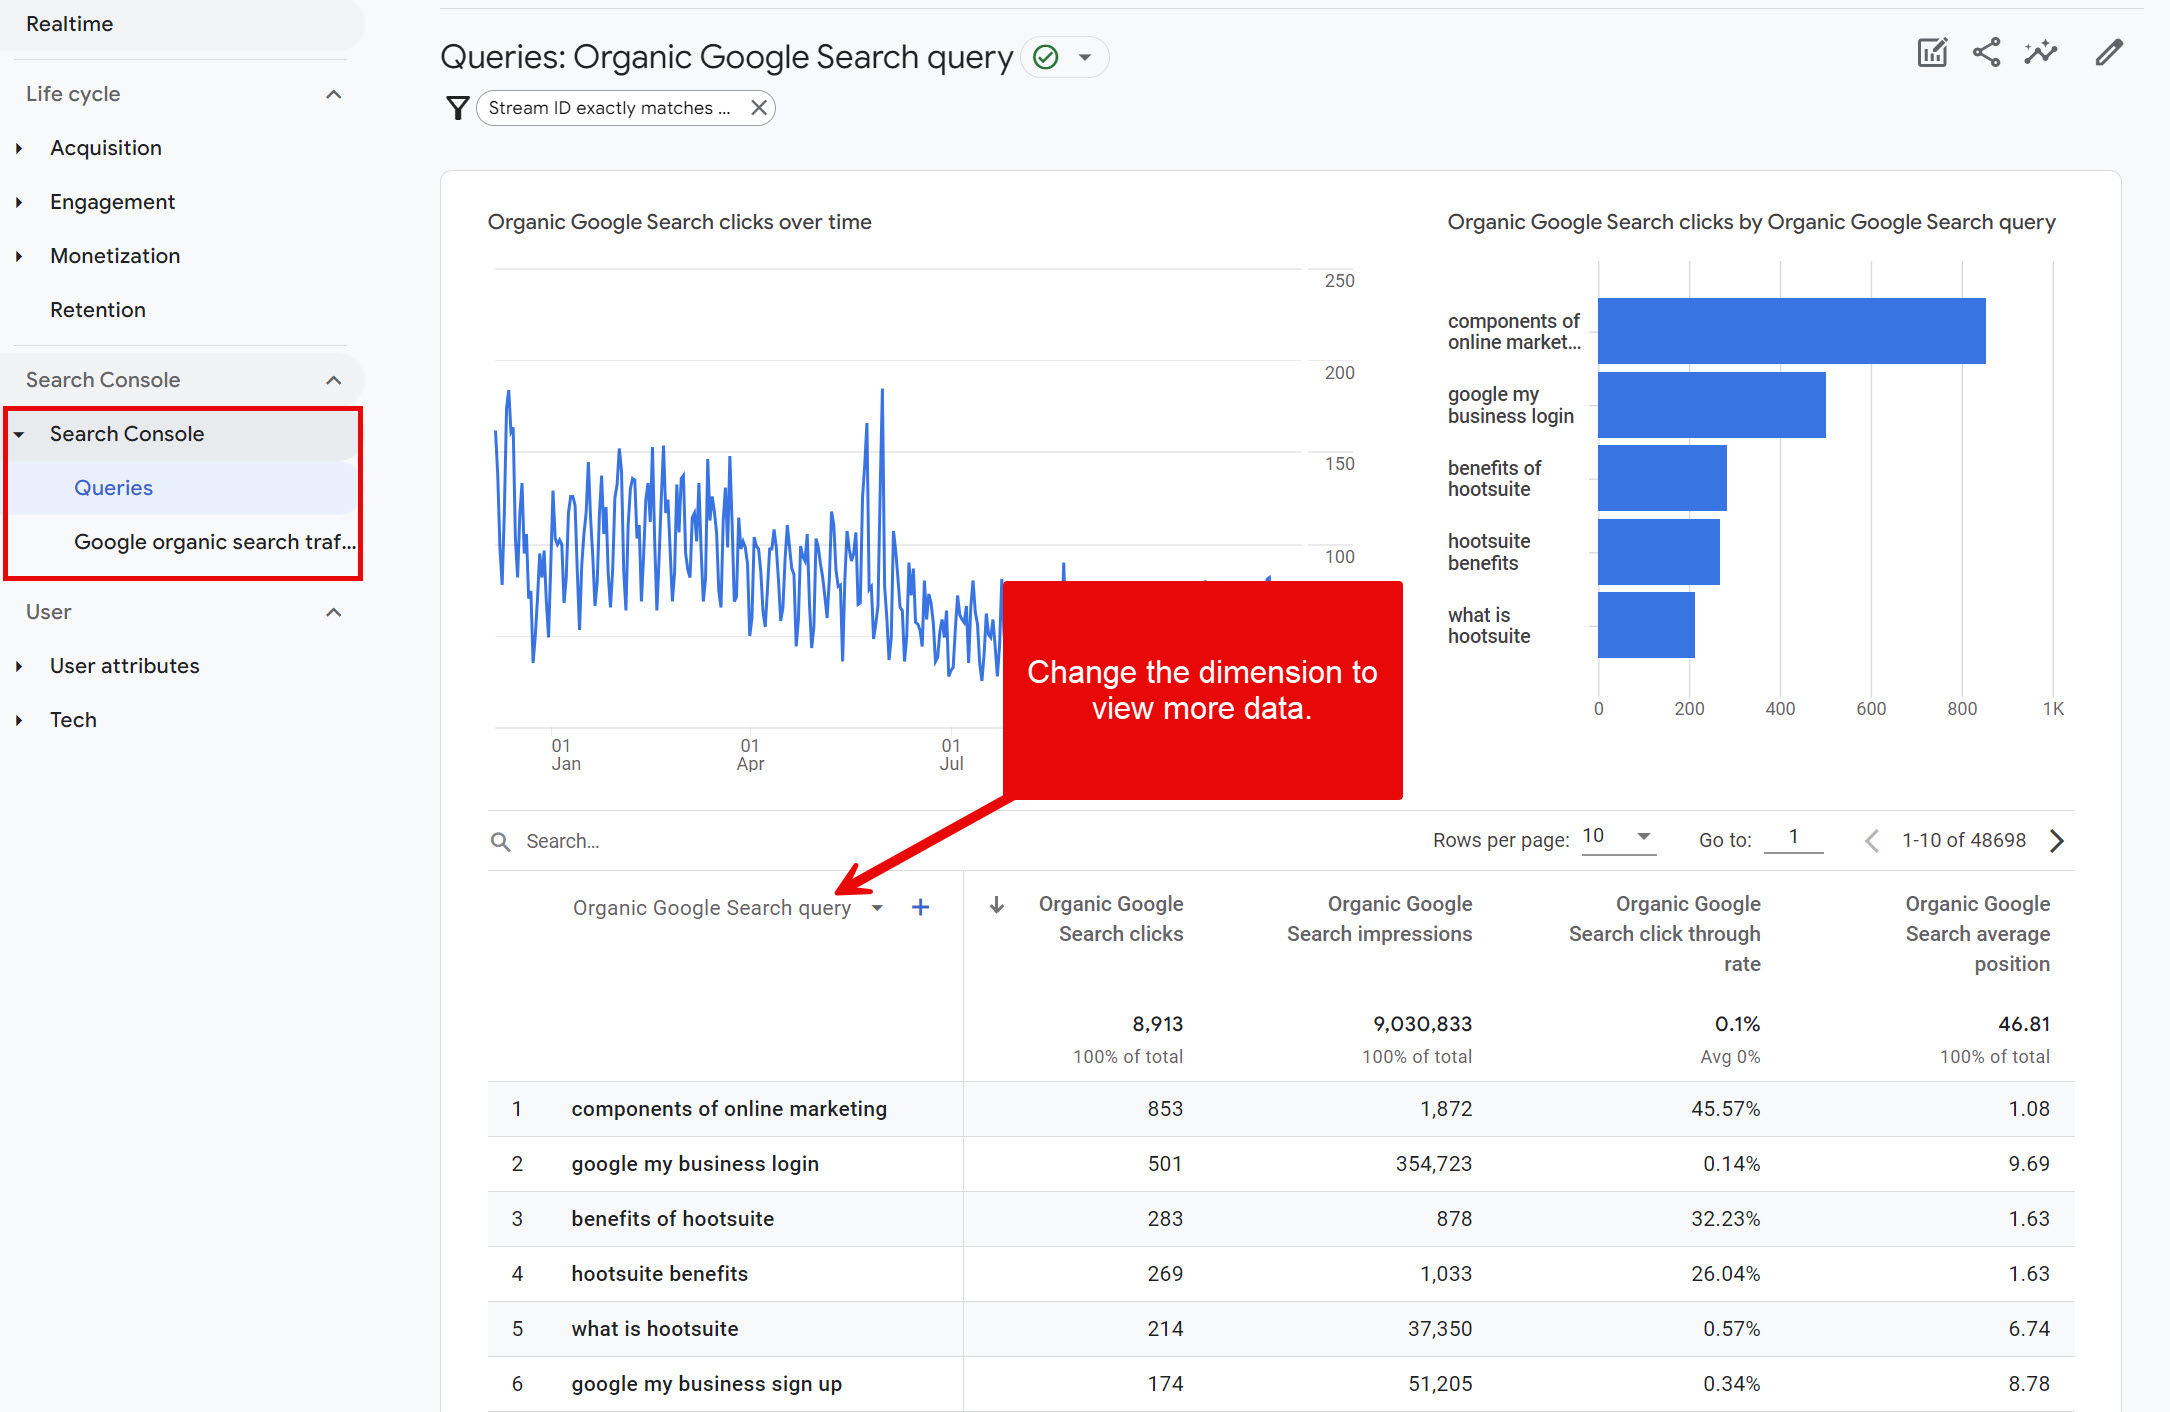
The Search Console Data metric provides information about the performance of your website or app in Google Search. Tracking this metric can help you optimize your website or app for better search engine visibility.
How to Access This Report:
- You’ll first need to link your GA4 and Google Search Console accounts.
- Once linked, under “Reports”, you will see “Search Console” data.
Google Organic Search Queries:
Displays search queries and associated Search Console metrics for the linked Search Console property. You can drill deeper into the data by Search Console dimensions (but not by Analytics dimensions).
Google Organic Search Traffic:
Displays landing pages with associated Search Console and Analytics metrics. You can drill into the data by the Country and Device dimensions.
6. Conversions & Goals
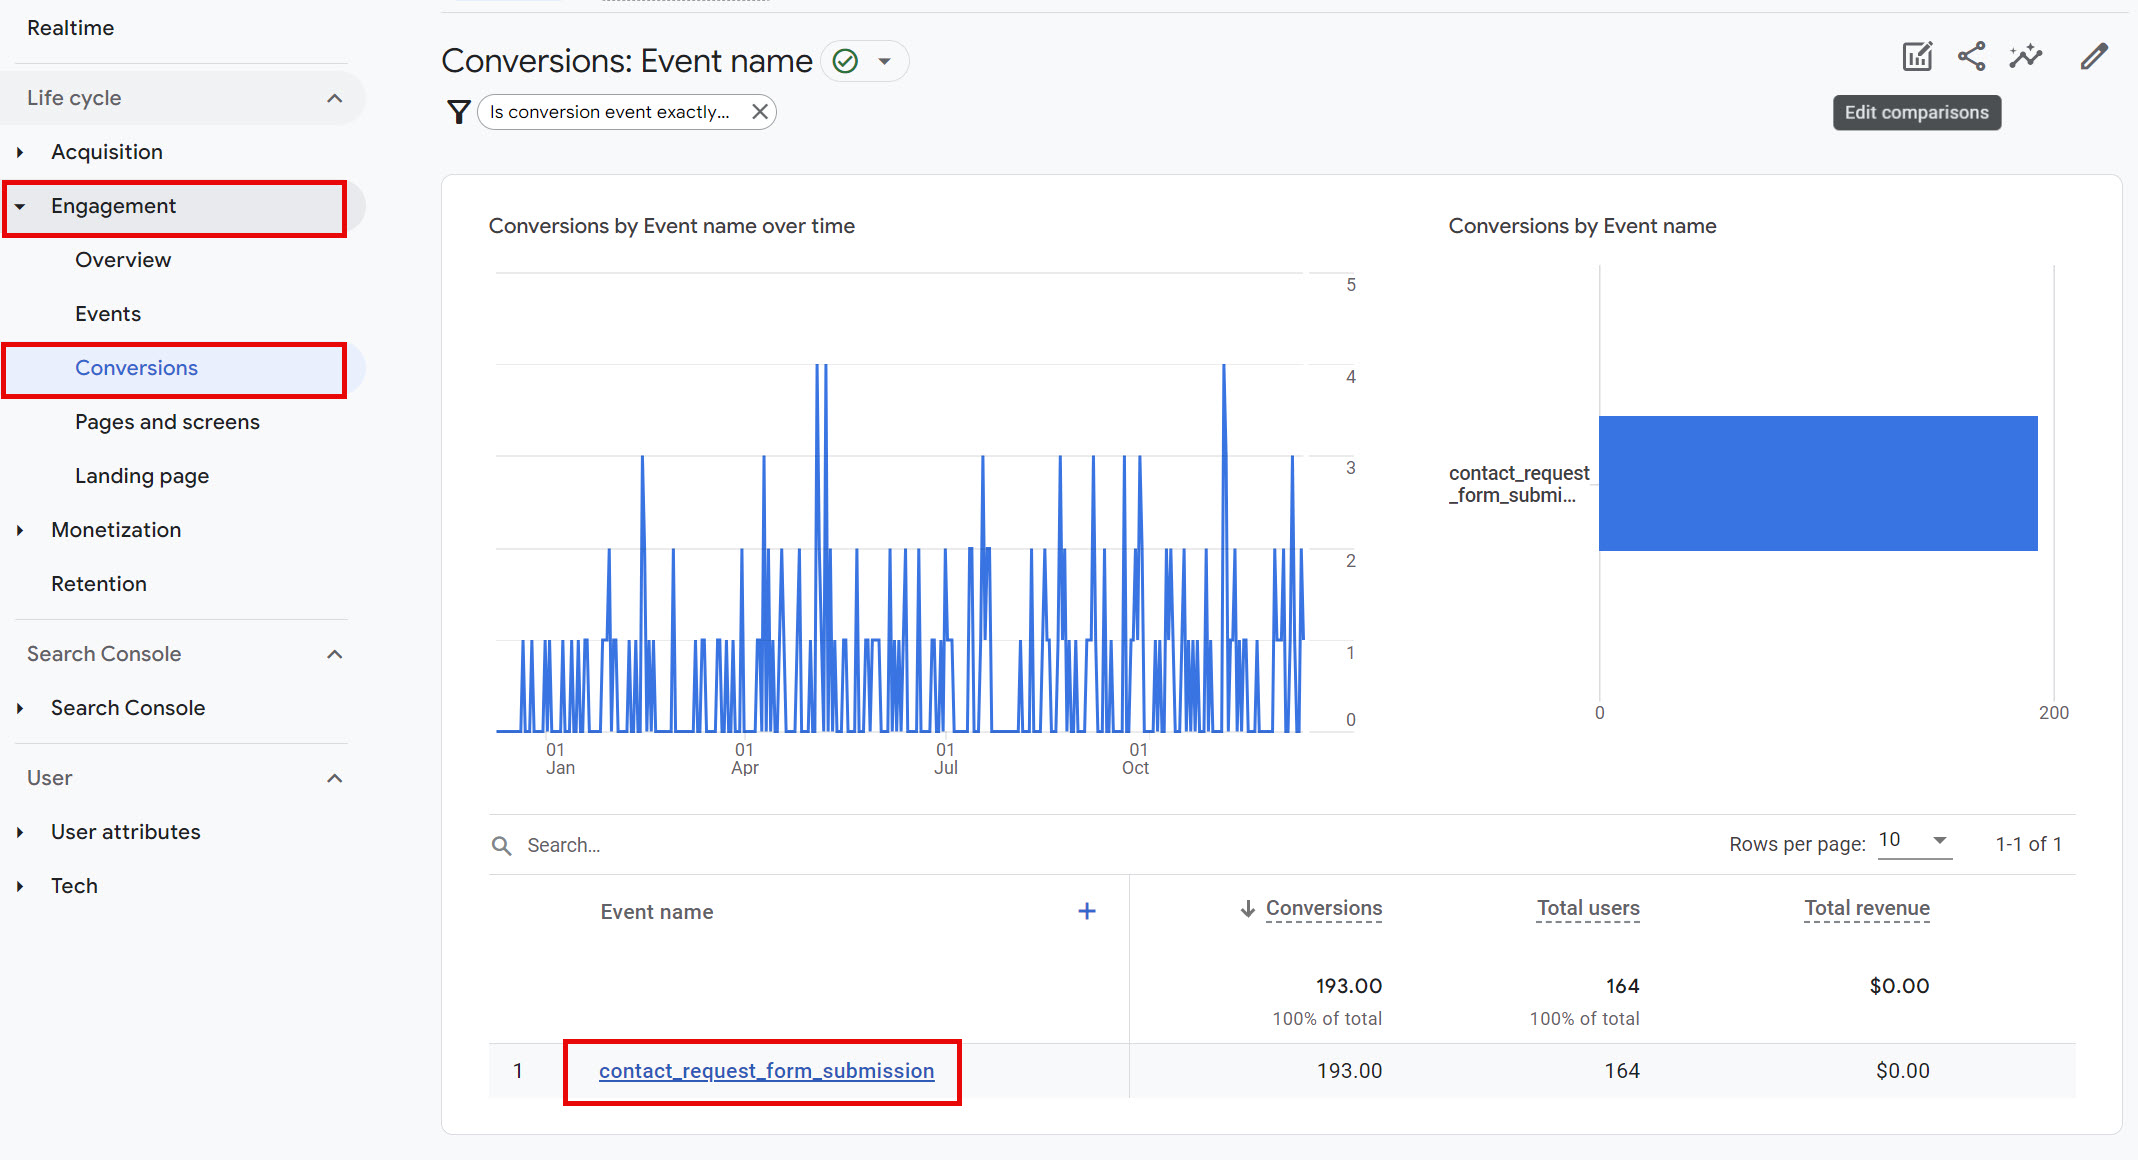
The Conversions and Goals metric measures the number of times users completed a specific action on your website or app. Tracking this metric can help you measure the effectiveness of your marketing campaigns and identify areas of improvement.
How to Access This Report:
- Conversions need to be set up as “Conversion events” in GA4’s admin in order to appear in the “Reports” (Instructions).
- Once set up, to view conversions, go to “Reports” > “Engagement” > “Conversions”.
- Click on the Event name (ex: Contact Request Form Submissions) to view conversions.
7. Tech Overview
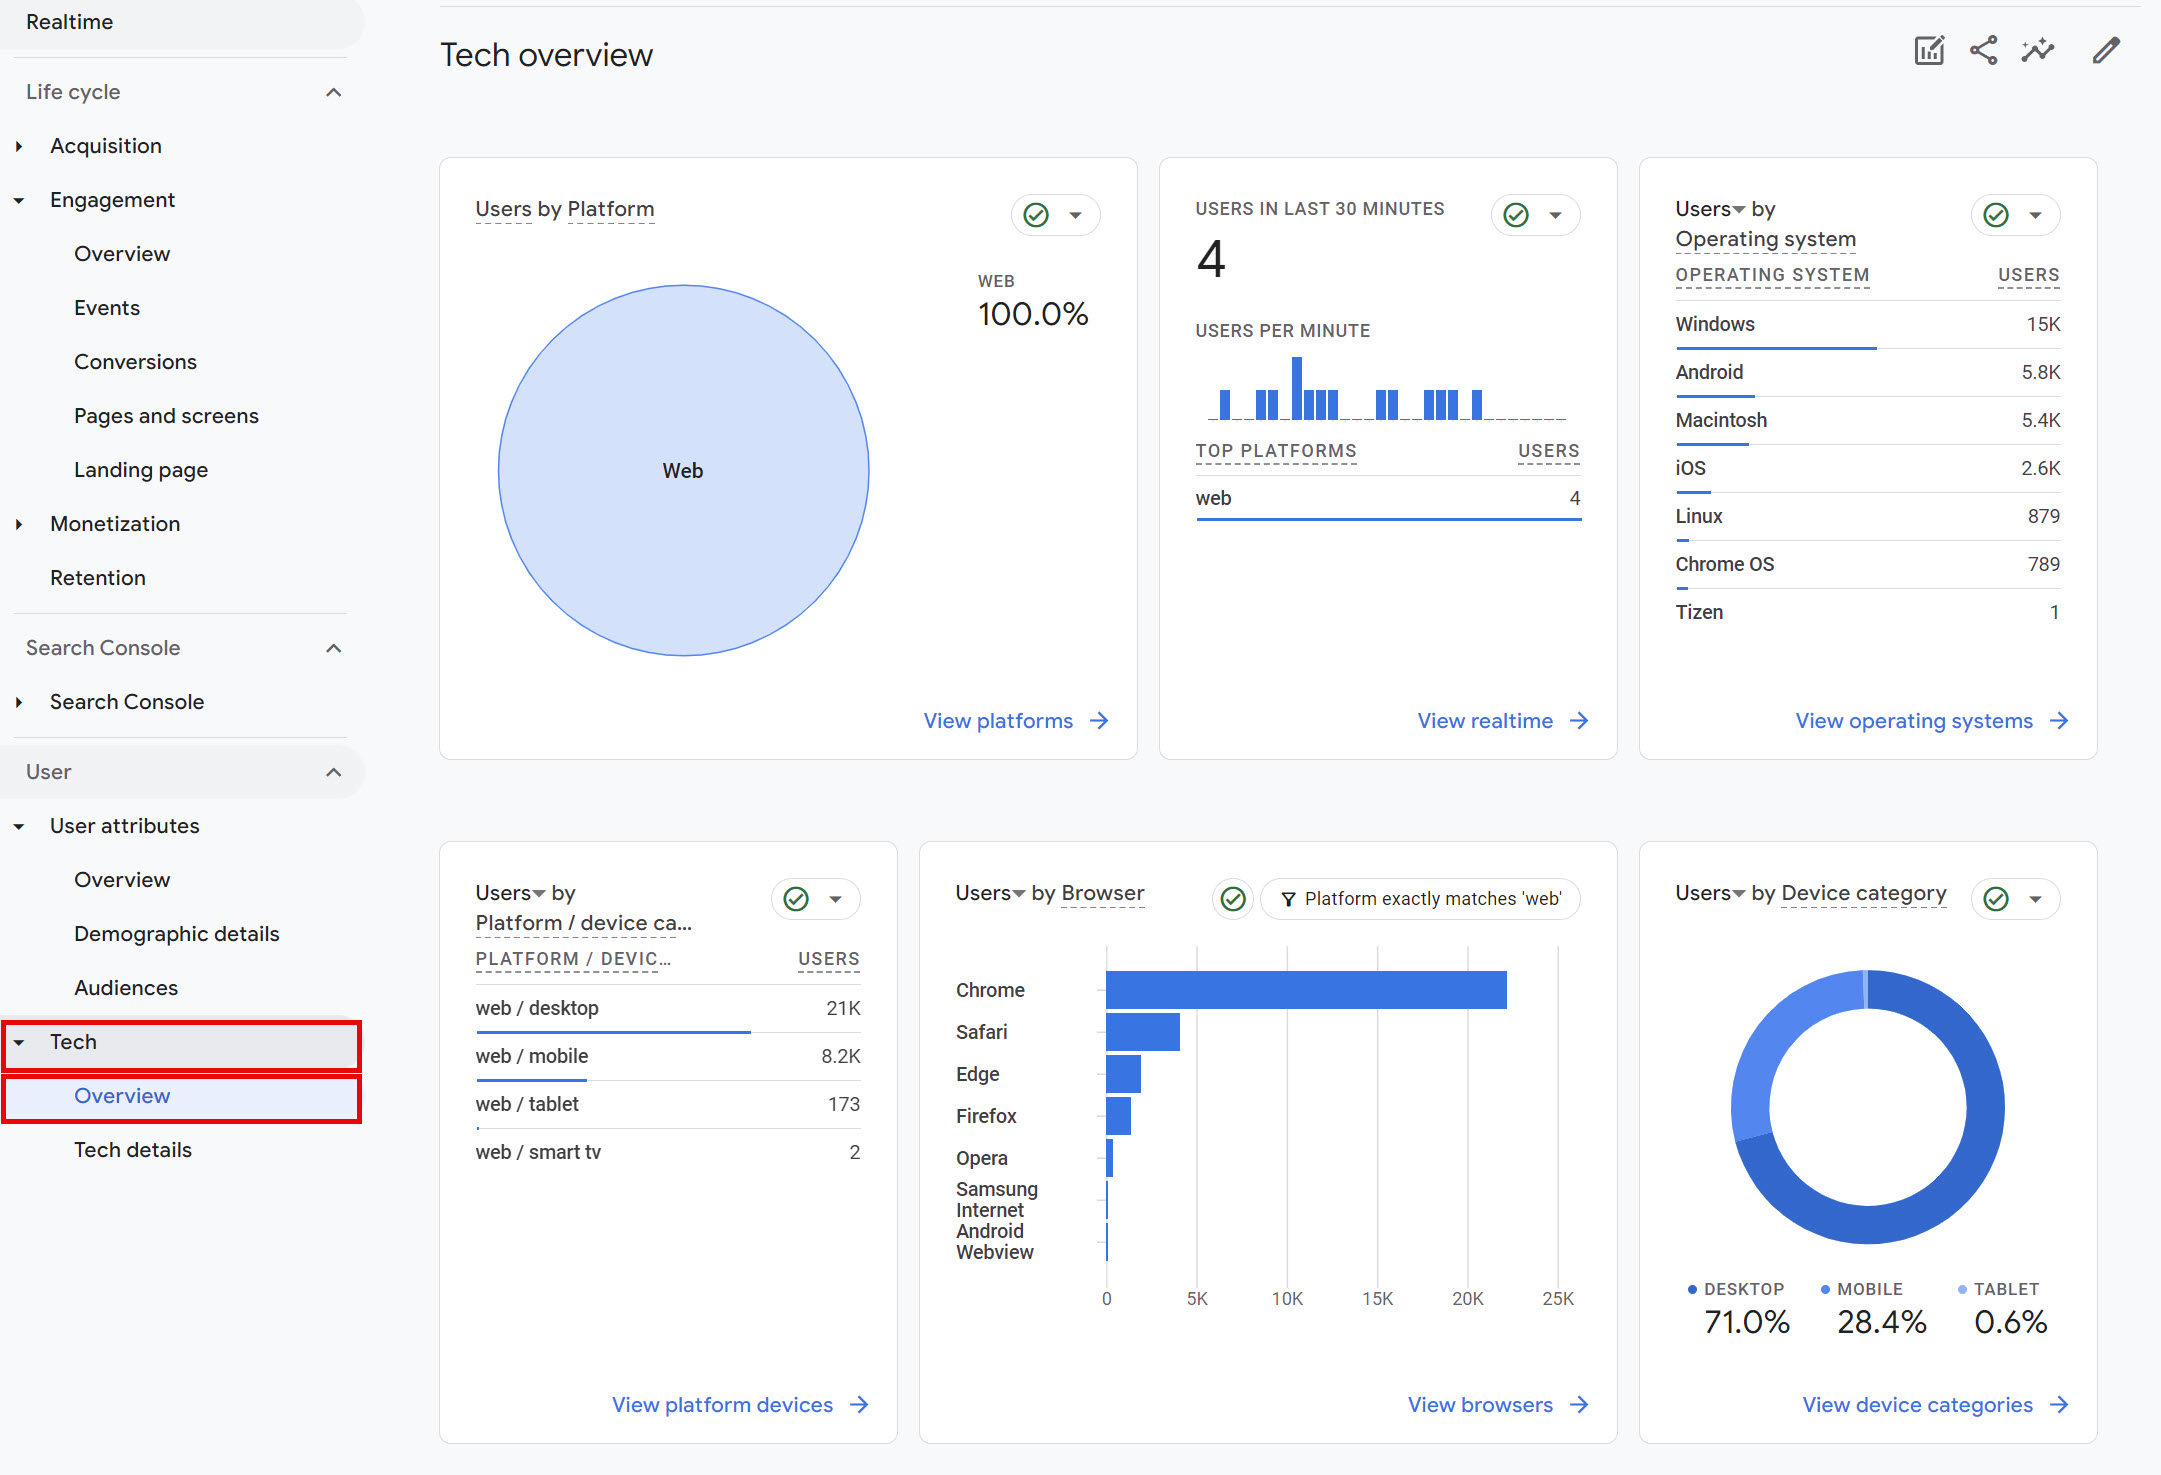
The Tech Overview metric provides information about the types of devices, browsers, platforms, and operating systems used to access your website. Tracking this metric can help you optimize your website for visitors and improve their user experience.
How to Access This Report:
- In GA4, click on “Reports” > “Tech” > “Overview”.
With GA4, you can measure practically anything, even custom metrics. In fact, it comes with so many metrics and dimensions that it can be hard to tell where to start. Starting with these 7 metrics will provide valuable insights and set you on the right track towards effectively tracking your digital marketing KPIs.
Are you ready to take your company to the next level? Contact us for a free digital marketing audit and strategy session.

About the Author
Katie Wilson, Owner
Aspire ID is a small digital marketing company in Denver, Colorado. Our mission is to empower business growth through superior digital marketing solutions and to build long-lasting client relationships. Since 2002, Katie and her team have helped home service businesses throughout the U.S. consistently grow and generate leads by providing best-in-class web design, SEO, PPC, content marketing, social media management, and reputation management and deploying targeted online marketing strategies driven by clear objectives.


